Youth's Lives Every Day
Background
Lesbian, gay, bisexual, transgender, queer, or questioning (LGBTQ) people are spread all across the United States (U.S.); however, estimates show that the largest proportion of LGBTQ individuals, 35%, live in the South (Harless, et al., 2019; The Williams Institute, 2019). Unfortunately, most states that have harmful anti-LGBTQ laws and lack those that protect LGBTQ people are in the southern region of the U.S. (Movement Advancement Project, 2021). A survey of LGBTQ adults in the South found that 69% of 18–24-year-olds had fair or poor mental health (Harless, et al., 2019). And while research has shown that unsupportive environments are associated with increased risk for attempting suicide among LGBTQ youth in the U.S. (Hatzenbuehler, 2011), far less is known about the status of LGBTQ youth living in the South. Using data from The Trevor Project’s 2021 National Survey on LGBTQ Youth Mental Health, this brief examines the characteristics and mental health of over 12,000 LGBTQ youth living in the U.S. South.
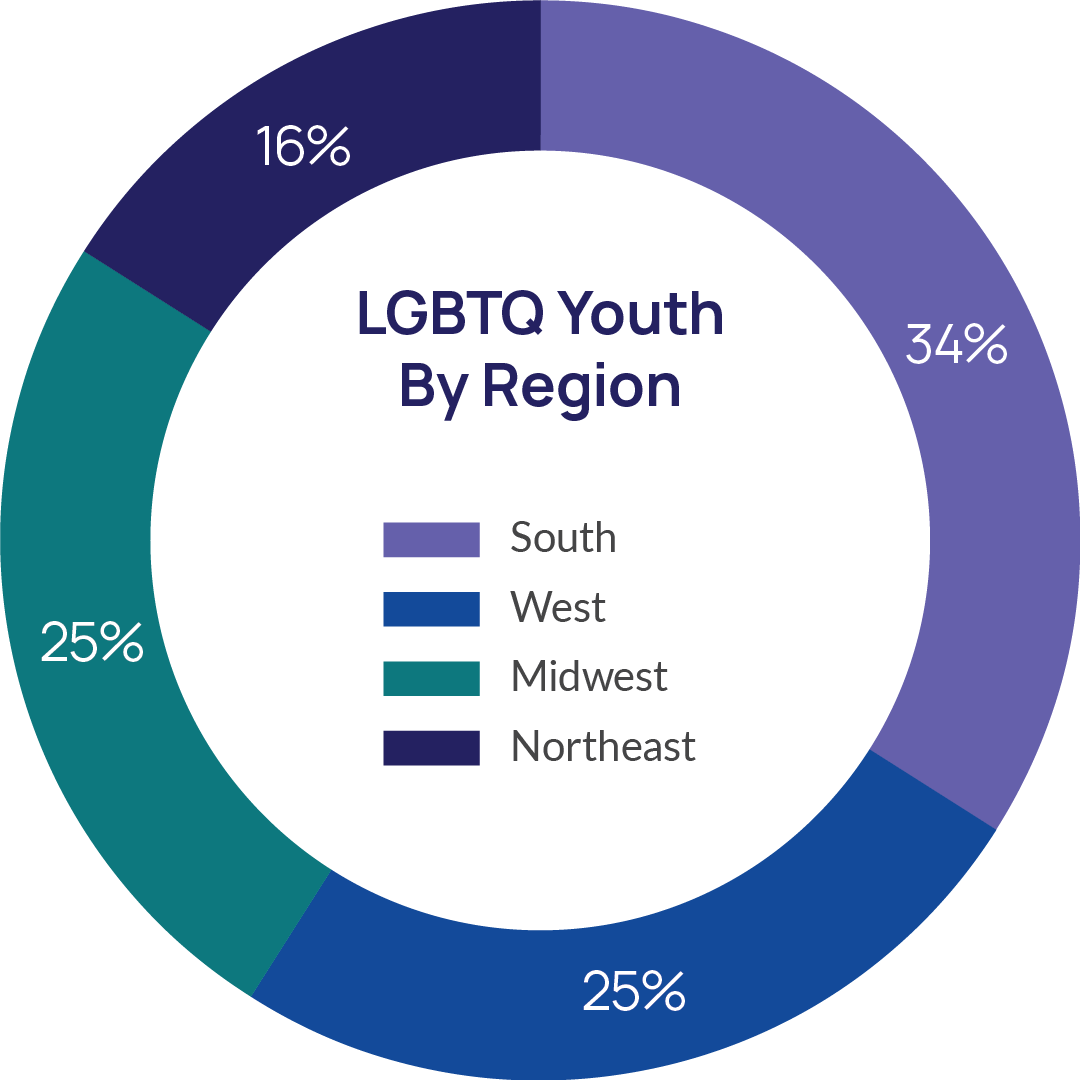
More than one in three youth in our sample lived in the U.S. South (35%). LGBTQ youth of color were more represented among LGBTQ youth in the South (48%) compared to other regions in the U.S (43%). Particularly, the percentage of LGBTQ youth in our sample who are Black was twice as high in the South (8%) compared to other regions of the U.S. (4%). Southern LGBTQ youth’s reported sexual orientations matched those of other regions in the U.S., as did their gender identity. Southern LGBTQ youth also reported using pronouns outside of the gender binary, such as they/them or combinations of pronouns like he/him and they/them (43%) at a similar rate to youth from other regions in the U.S. (42%). However, a higher rate of LGBTQ youth in the South did report feeling that religion was very important to them (25%) compared to LGBTQ youth in other regions (23%).
LGBTQ youth in the South had 9% greater odds (aOR = 1.09, p=.03) of a past-year suicide attempt compared to those in other regions of the U.S. LGBTQ youth in the South reported higher rates of seriously considering suicide (44%) compared to LGBTQ youth in other parts of the country (41%). Furthermore, 16% of LGBTQ youth in the South attempted suicide in the past year compared to 14% of LGBTQ youth in other regions.
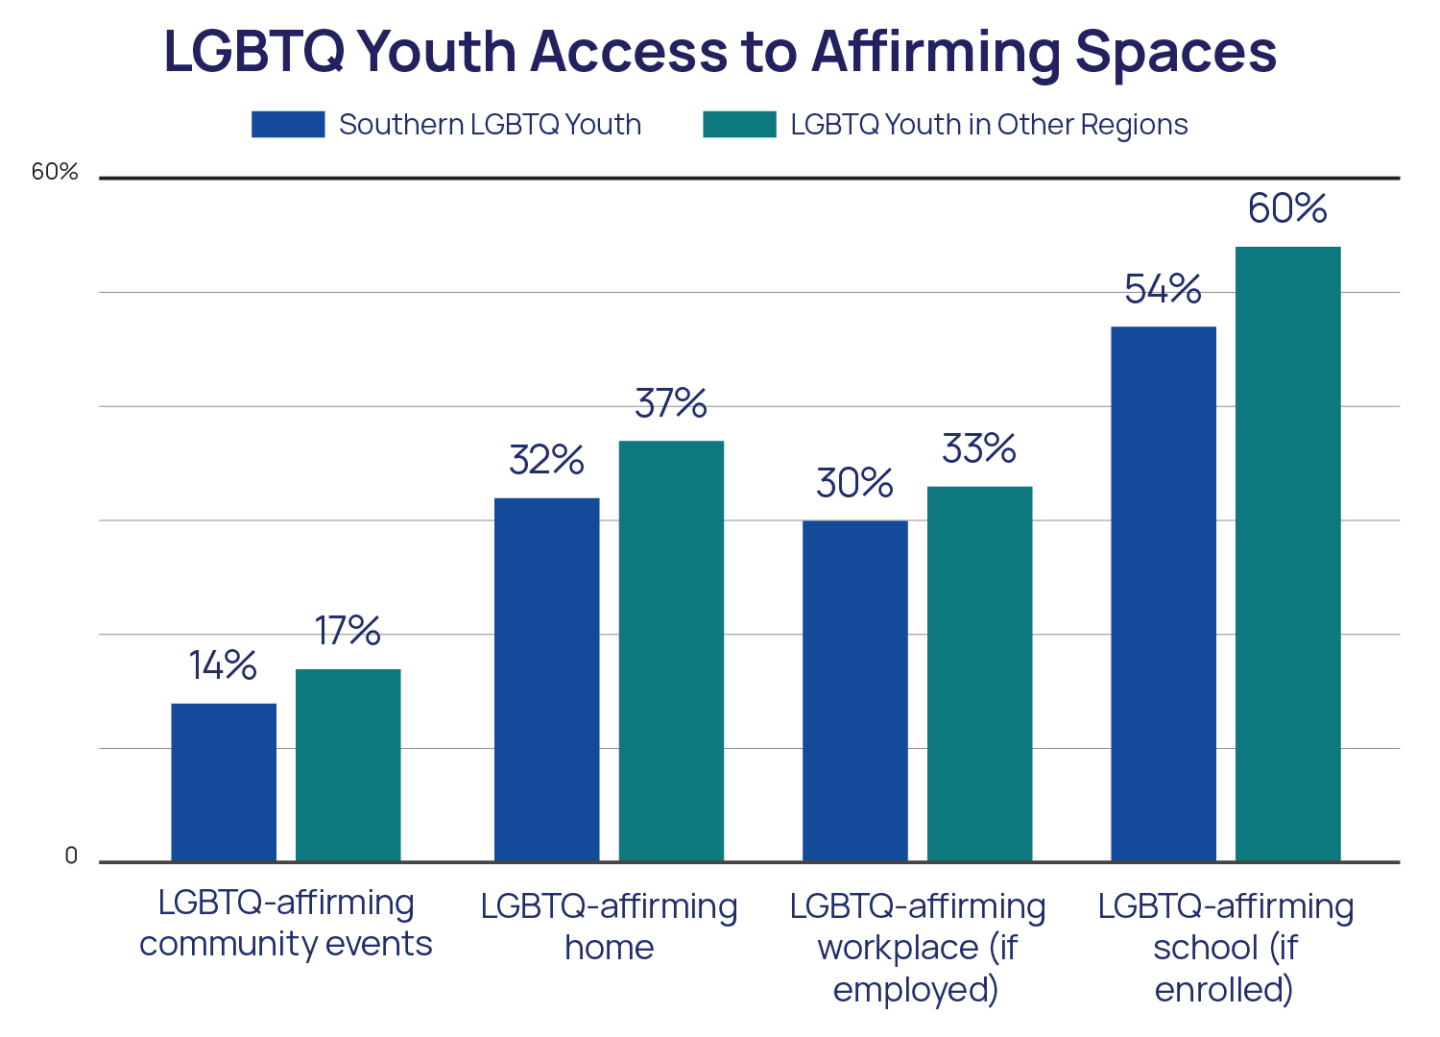
LGBTQ youth in the South reported having less access to LGBTQ acceptance and affirming spaces. Overall, nearly half of LGBTQ youth in the South (46%) reported that their community was somewhat or very unaccepting compared to less than a third of LGBTQ youth in other regions of the U.S. (32%). Southern LGBTQ youth also reported lower rates of access to an LGBTQ-affirming home (32%), school (47%), workplace (30%), and community events (14%) compared to LGBTQ youth in other parts of the country. Southern LGBTQ youth are also subjected to conversion therapy at higher rates (15%) compared to LGBTQ youth in other parts of the country (12%). Additionally, transgender and nonbinary youth living in the South reported lower rates of having everyone in their life respect their pronouns (27% vs 34%) and wanting but not being able to change their official documents to match their gender identity (66% vs 54%) compared to transgender and nonbinary youth in other regions of the U.S.
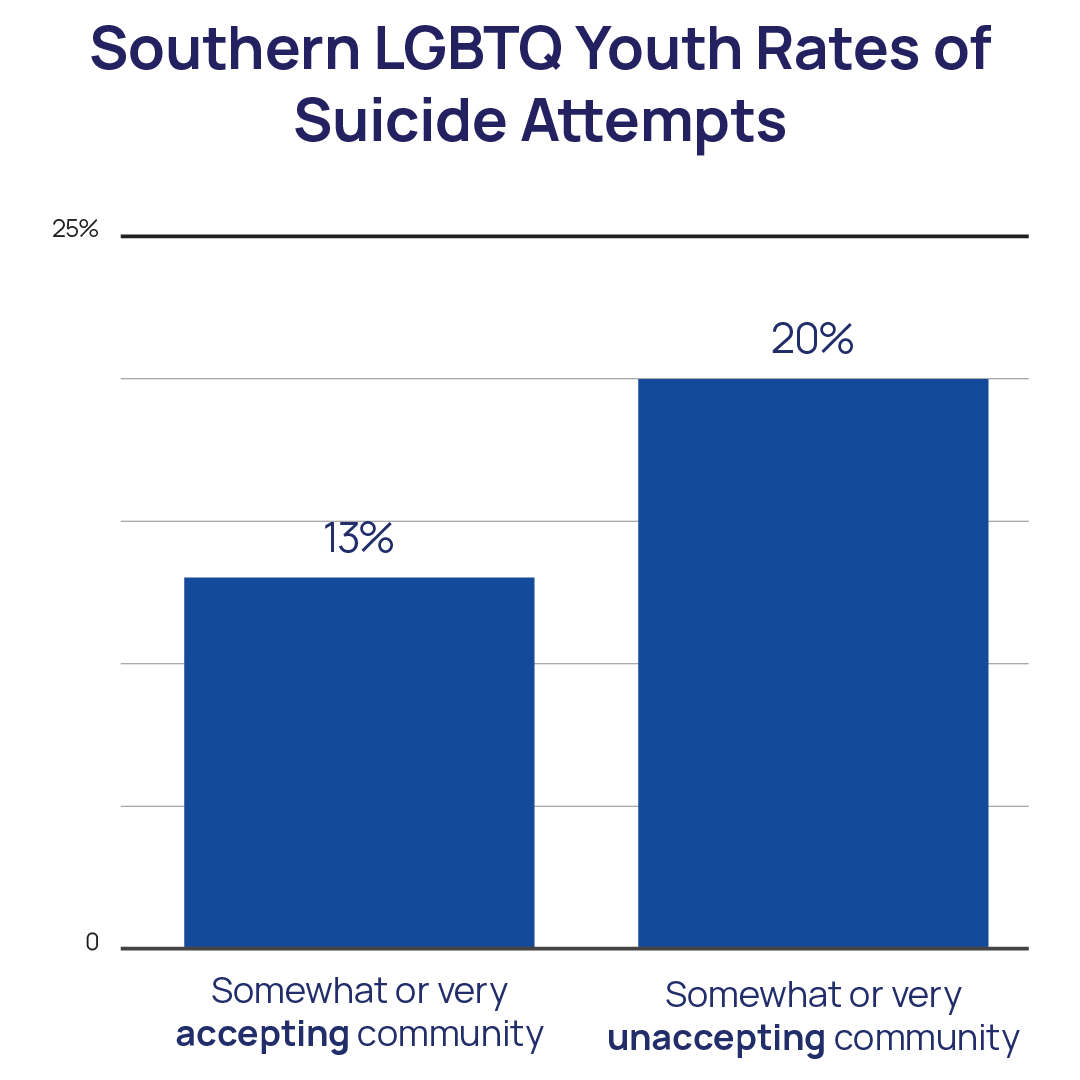
Southern LGBTQ youth were less likely to attempt suicide when they reported feeling affirmed in their sexual orientation and gender identity. Southern LGBTQ youth living in somewhat or very accepting communities had more than 40% lower odds of reporting a suicide attempt in the past year (aOR=.59,p<.001). LGBTQ youth in the South with at least one in-person LGBTQ-affirming space also had more than 40% lower odds of reporting a suicide attempt in the past year (aOR = .59, p<.001). Transgender and nonbinary youth in the South whose pronouns were respected by even some of the people in their lives had 42% lower odds of attempting suicide the past year (aOR = .42, p<.001), and those whose pronouns were respected by everyone in their lives had 58% lower odds of attempting suicide in the past year compared to transgender and nonbinary youth in the South whose pronouns were not respected by anyone in their lives. Additionally, transgender and nonbinary youth in the South who were able to change their official documents, but had yet to do so, had 38% lower odds of reporting a suicide attempt in the past year (aOR = .38, p<.001) compared to those who wanted to but were not able to do so.
Methods
Data were collected from an online survey conducted between October and December of 2020 among 34,759 LGBTQ youth recruited via targeted ads on social media. Youth were asked “What state do you live in?” and from there, the four major United States Census regions were computed. Items on considering and attempting suicide in the past 12 months were taken from the Centers for Disease Control and Prevention’s Youth Risk Behavior Survey (Johns et al., 2020). Adjusted logistic regression models controlled for race/ethnicity, socioeconomic status, sex assigned at birth, gender identity, and sexual identity.
Looking Ahead
These data show that, due to the U.S. population distributions, the largest proportion of LGBTQ youth live in southern states. This is particularly true for Black LGBTQ youth. LGBTQ youth in the South are no less likely to identify with emerging sexual orientation and gender identity labels, such as pansexual or nonbinary, and their use of pronouns outside of the gender binary is no less frequent than their LGBTQ peers in other regions of the country. However, despite these similarities, LGBTQ youth in the South report less access to affirmation and support of their identities through LGBTQ-affirming spaces, respect for their pronouns, protections from discrimination, harm and conversation therapy, and the ability to change their official documents to match their gender identity. Southern LGBTQ youth also reported slightly higher rates of seriously considering suicide and attempting suicide compared to youth in other regions of the U.S.
However, our findings underscore that southern LGBTQ youth who are affirmed in their identities and live in accepting places are less likely to attempt suicide. Having access to even just one LGBTQ-affirming space — one that allows LGBTQ youth to feel like they can be their authentic selves — significantly reduces a southern LGBTQ young person’s risk for suicide. Transgender and nonbinary youth living in the South were also less likely to attempt suicide when their identity was affirmed through respect for their pronouns and having the ability to change their official documents to match their gender identity. These findings illustrate the importance of a supportive environment for LGBTQ youth. Stakeholders working with youth in the South must be inclusive and supportive of LGBTQ identities as a means to promote positive mental health and well-being.
The Trevor Project is dedicated to finding ways to support LGBTQ youth in the South and bring awareness to their unique needs. Our Crisis Services are available 24/7 to any LGBTQ youth in need and our Advocacy Team continues to fight harmful legislation, as well as advancing protective legislation, for LGBTQ youth living in the South. Finally, our research will continue to explore risks and protective factors specific to southern LGBTQ youth to further understand and help prevent suicide among this group.
Recommended Citation: The Trevor Project. (2021). LGBTQ Youth in The South. https://doi.org/10.70226/MFXQ7925
References
- Harless, C., M. Nanney, A.H. Johnson, A. Polaski, and J. Beach-Ferrara. (2019). The Report of the 2019 Southern LGBTQ Health Survey. Campaign for Southern Equality: Asheville, NC.
- Hatzenbuehler M. L. (2011). The social environment and suicide attempts in lesbian, gay, and bisexual youth. Pediatrics, 127(5), 896–903. https://doi-org.proxyiub.uits.iu.edu/10.1542/peds.2010-3020
- Movement Advancement Project (2021). Equality Maps Snapshot: LGBTQ Equality By State. https://www.lgbtmap.org/equality-maps/. Accessed 10/20/2021.
- The Williams Institute (2019). LGBT Demographic Data Interactive. Los Angeles, CA: The Williams Institute, UCLA School of Law.
For more information please contact: [email protected]
© The Trevor Project 2021